
Technical analysis plays a crucial role in modern stock trading, helping investors and traders make informed decisions by analyzing historical price movements and market trends. Unlike fundamental analysis, which looks at a company’s financials and market position, technical analysis focuses purely on price and volume data to predict future stock price movements.
If you want to start trading stocks, it is important to first understand market basics, order types, and risk management.
What is Technical Analysis?
Technical analysis is the study of past market data, primarily price and volume, to forecast future stock price movements. Traders use charts and various technical indicators to identify trends, reversals, and potential entry or exit points for trades.
The core principle of technical analysis is that market prices move in trends. By analyzing historical price action, traders believe they can predict the direction of future price movements. Unlike fundamental analysis, which focuses on a company’s intrinsic value, technical analysis assumes that all information - whether public or private - is already reflected in the stock’s price.
Key Tools and Indicators in Technical Analysis
There are several key tools and indicators used in technical analysis. These tools help traders identify trends, measure volatility, and make more informed decisions. Below are some of the most common indicators and chart patterns you should know when applying technical analysis:
1. Price Charts
Price charts are the most fundamental tool in technical analysis. A price chart visually represents a stock’s price movement over time. The two most common types of price charts are:
Line Charts: A simple representation of price movement, showing the closing price for each time period.
Candlestick Charts: A more advanced charting method that shows the open, close, high, and low prices for each time period. Candlestick charts provide more detail than line charts and are popular for spotting trend reversals and price patterns.
2. Moving Averages
Moving averages are widely used to smooth out price data and identify trends. A moving average calculates the average price of a stock over a specific time period. The two most common types are:
Simple Moving Average (SMA): This is the average of a stock’s closing prices over a specific period, such as 50 days or 200 days.
Exponential Moving Average (EMA): Similar to the SMA, but it gives more weight to recent prices, making it more responsive to price changes.
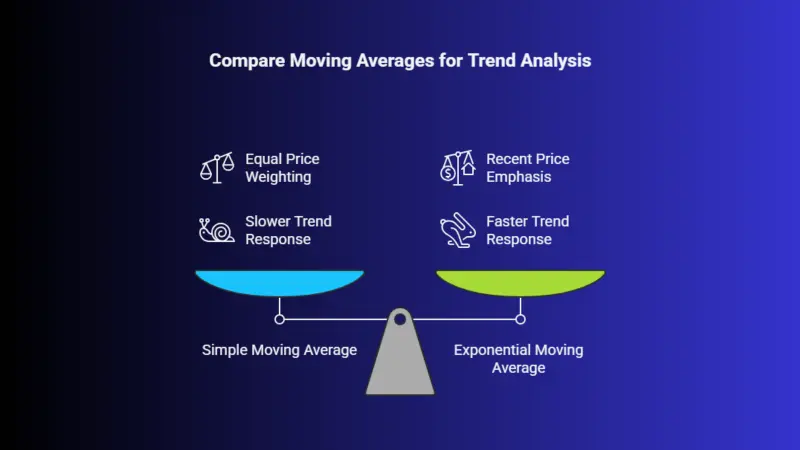 Moving averages help traders identify the direction of the trend. When the stock price is above the moving average, it indicates an uptrend, and when it is below, it suggests a downtrend.
3. Relative Strength Index (RSI)
The RSI is a momentum oscillator that measures the speed and change of price movements. The RSI ranges from 0 to 100, and it is used to identify overbought or oversold conditions in a stock.
Overbought: An RSI above 70 suggests that the stock may be overbought and due for a pullback.
Oversold: An RSI below 30 indicates that the stock may be oversold and could be primed for a price rebound.
The RSI helps traders identify potential buying or selling opportunities based on market sentiment.
4. Support and Resistance Levels
Support and resistance levels are key price levels where stocks tend to reverse direction. These levels are determined by previous highs and lows and are essential for identifying potential entry and exit points.
Support Level: The price level where a stock tends to find buying interest and bounce higher.
Resistance Level: The price level where a stock tends to face selling pressure and struggles to move higher.
Traders use these levels to set price targets and stop-loss orders, ensuring they manage risk effectively.
5. Bollinger Bands
Bollinger Bands consist of a middle band (a simple moving average) and two outer bands (standard deviations away from the moving average). The bands expand and contract based on market volatility.
Wide Bands: Indicate high volatility, suggesting that the stock could experience significant price movement.
Narrow Bands: Indicate low volatility, suggesting that the stock might be consolidating before a breakout or breakdown.
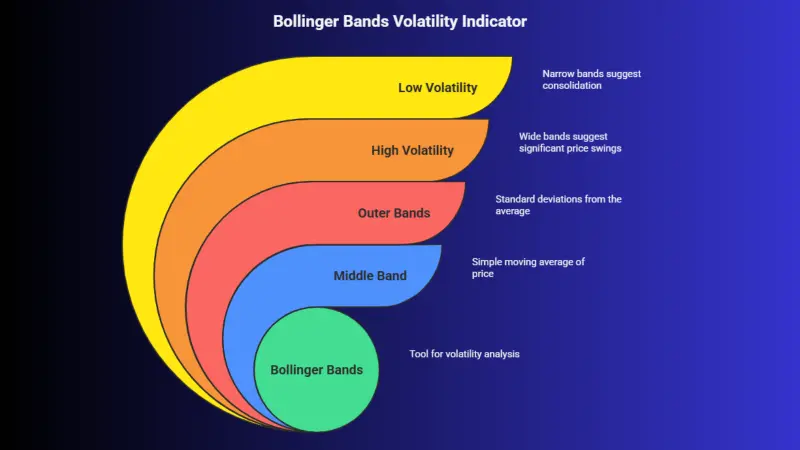 Bollinger Bands help traders gauge volatility and potential price breakouts.
6. Moving Average Convergence Divergence (MACD)
The MACD is a trend-following momentum indicator that shows the relationship between two moving averages (usually the 12-day and 26-day EMAs). It consists of two components:
MACD Line: The difference between the 12-day and 26-day EMAs.
Signal Line: The 9-day EMA of the MACD line.
When the MACD crosses above the signal line, it is considered a bullish signal, and when it crosses below, it is considered bearish. The MACD helps identify trends and potential reversals.
Many beginners choose to start trading stocks after building an emergency fund and selecting a reliable brokerage platform.
How to Apply Technical Analysis in Stock Trading
 To apply technical analysis effectively, traders follow these steps:
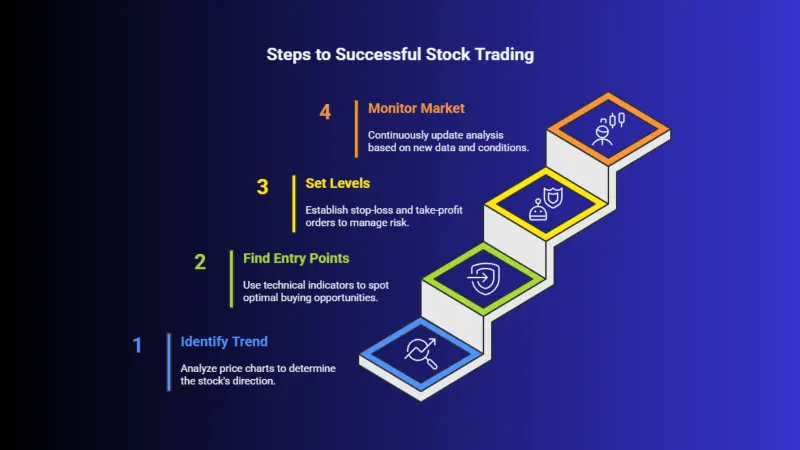
1. Identify the Trend
Start by analyzing the overall trend using price charts and moving averages. Is the stock in an uptrend, a downtrend, or sideways? Identifying the trend will help you decide whether to buy, sell, or wait.
2. Look for Entry Points
Use technical indicators like the RSI, MACD, and Bollinger Bands to find optimal entry points. For example, if a stock is in an uptrend and the RSI suggests that it is oversold, this could present a good buying opportunity.
3. Set Stop-Loss and Take-Profit Levels
Based on support and resistance levels, set stop-loss and take-profit levels to manage risk. Stop-loss orders protect you from large losses, while take-profit orders lock in profits once the stock reaches your target price.
4. Monitor Market Conditions
Technical analysis is not a one-time task. Continuously monitor your stock positions and update your analysis based on new data, market conditions, and price movements.
Final Thoughts
Technical analysis is an essential tool for stock traders looking to make informed decisions based on price trends and market data. By using tools like price charts, moving averages, and indicators such as the RSI and MACD, you can identify potential trading opportunities and manage risk effectively. You can start trading stocks today by opening a demat and trading account and placing your first small-value trade. Log in to your trading platform today and start using technical analysis to enhance your stock trading strategy.