One live view of your entire supply chain, not six spreadsheets.
For FMCG, food & beverage, dairy and auto components businesses running multi-SKU, multi-lane, multi-distributor operations on SAP or WMS.
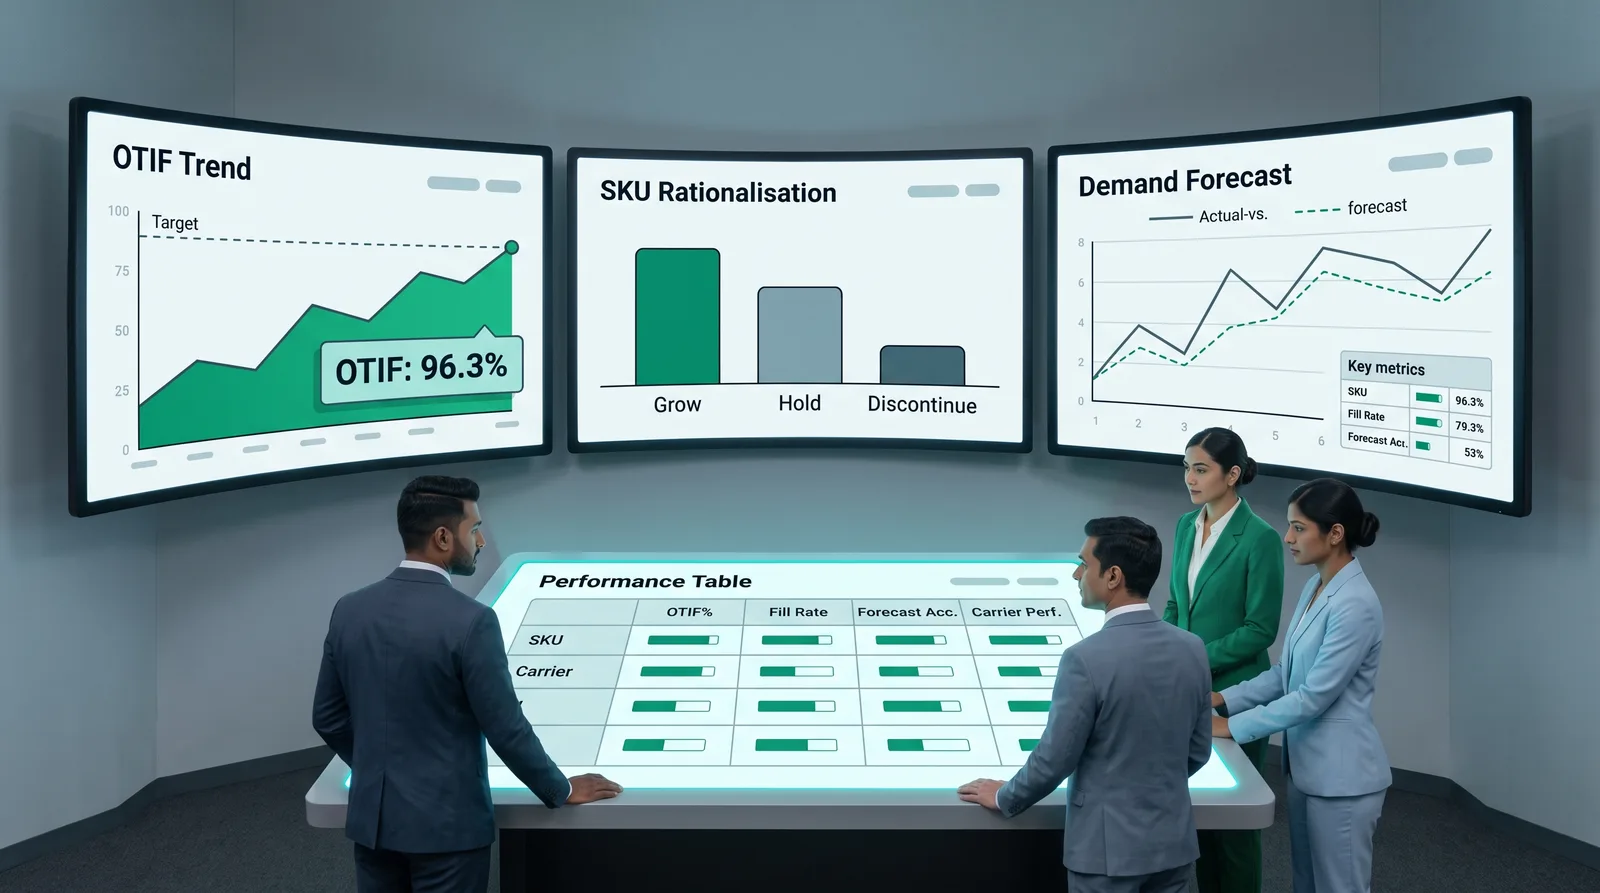
Who it's for
FMCG, food & beverage, dairy and auto components businesses running multi-SKU, multi-lane, multi-distributor operations on SAP or WMS.
Typically championed by
The shift
OTIF, freight cost and fill-rate visibility today is a multi-day manual MIS assembly exercise across six or more separate files. Demand planning is reactive rather than forward-looking, and freight or distributor-level leakage is found retrospectively, if at all.
A multi-day manual MIS assembly becomes a live daily view. Supply chain and freight-cost leakage becomes visible in real time instead of being discovered after the fact.
How it works
Live modules built directly from SAP, WMS and email data, with no ERP change: OTIF tracking by distributor and lane, SKU fill rate monitoring, SKU rationalisation analysis, freight cost analytics by route, rate analytics, demand forecasting/planning, and inventory management, all in one always-current view.
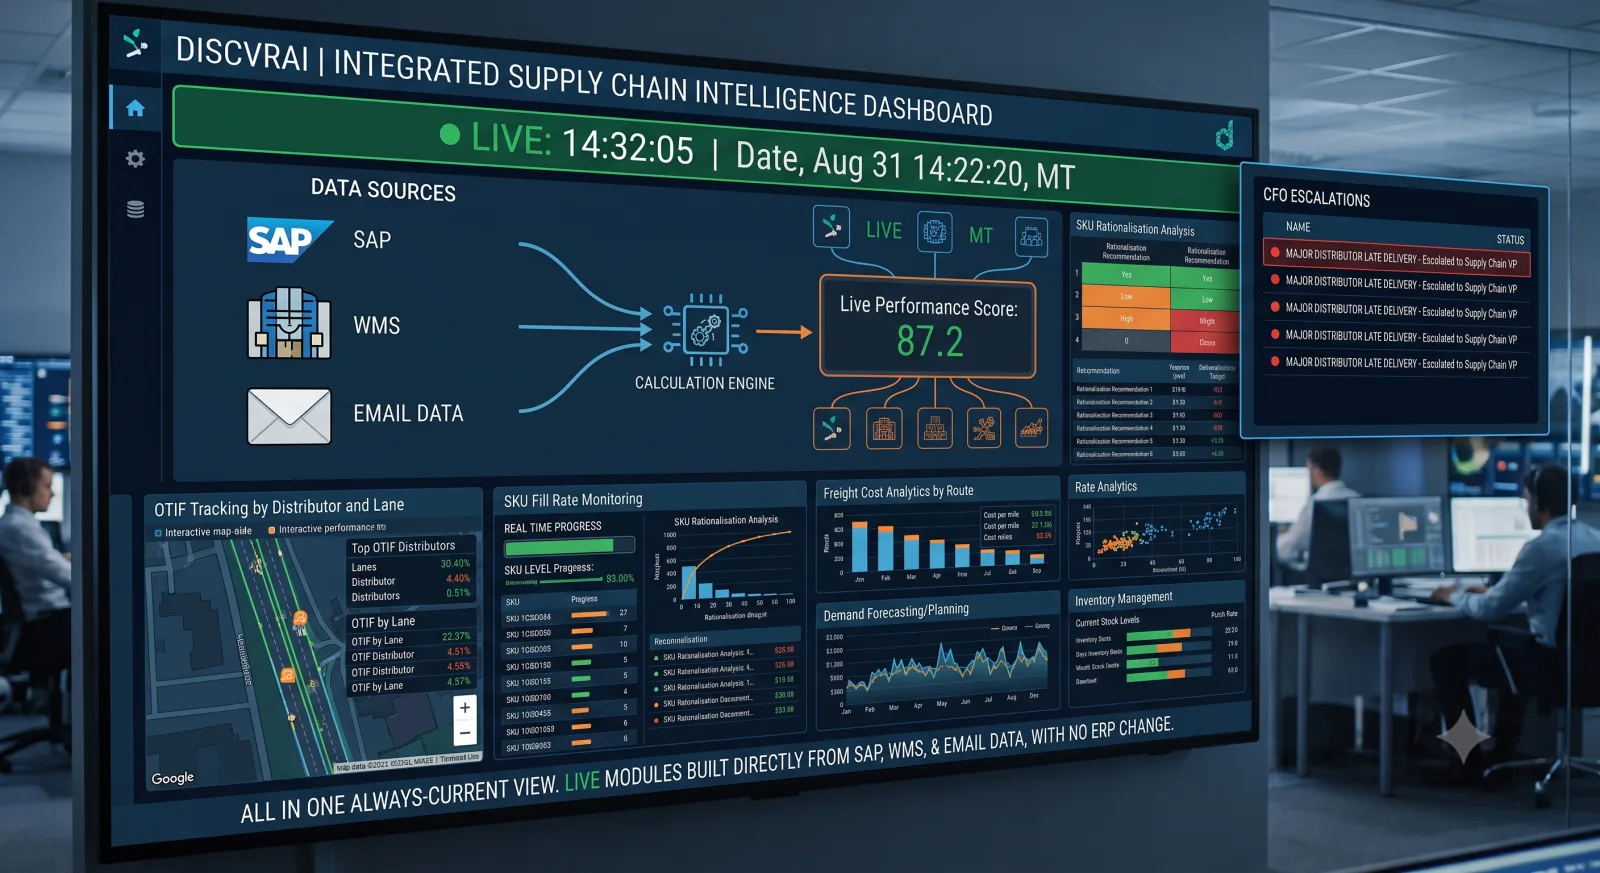
Modules & sub-capabilities
OTIF Tracking
On-time-in-full tracking by distributor and lane, replacing the multi-day manual MIS assembly most teams run today, delivery performance is visible live instead of stitched together after the fact.
SKU Fill Rate
Fill-rate monitoring at SKU level, live rather than reconstructed at month-end, so a fill-rate slip is visible the day it happens, not weeks later in a spreadsheet review.
SKU Rationalisation
A workbench, not a report, buckets every SKU into end-to-end rationalisation buckets (grow, hold, rework, discontinue), then lets the team run what-if scenarios against those buckets before anything is final. The team stays in control of the call; the AI does the sorting and scenario math.
Freight Cost Analytics
Freight cost analytics by route, surfacing leakage in real time instead of the retrospective discovery most teams are stuck with today.
Rate Analytics
Rate analytics across lanes and distributors, so rate disparities and negotiation opportunities are visible without a manual cross-file comparison.
Demand Forecasting & Planning
Forward-looking demand forecasting and planning, not a historical report, built to move planning from reactive to proactive.
Inventory Management
Always-current inventory visibility across SKUs and locations, replacing the periodic manual stock reconciliation most teams rely on today.
Alerts & Exceptions
Threshold alerts on OTIF, fill rate and freight cost, so a slip surfaces the day it happens and routes to an owner, instead of waiting to be discovered in the next MIS cycle.
Agents deployed for this module
These are the named agents we deploy when Supply Chain Suite is the production module for your business problem. Each agent is a job we deploy for you. You do not buy software and install it yourself.
OTIF & Freight Visibility Agent
Real-time visibilityLive OTIF, freight cost, and fill-rate visibility without a new ERP.
See how we deploy thisSKU Rationalisation Agent
1 to 2% revenue upliftCut the tail, invest where demand is, with a defensible workbench.
See how we deploy thisDemand Forecast Agent
Forward-looking demandForward-looking demand planning without new infrastructure.
See how we deploy thisRelated case studies
A large FMCG exporter tracked OTIF, freight and fill-rate across six or more manual files.
Supply chain and freight-cost leakage became visible in real time instead of after the fact.
A national dairy cooperative had no forward-looking view of demand across its distributor network.
Demand planning moved from reactive to forward-looking without new infrastructure.
A tier-1 auto components manufacturer discovered SKU-level fill-rate gaps only after customer escalation.
Fill-rate and freight issues now surface before they reach the customer.
You might also need
Related insights
Predictive Maintenance Is Old. Agentic Maintenance Is the New Opportunity
Predictive maintenance stops at flagging risk, it doesn't act on it. Agentic maintenance converts a machine alert into a structured, actionable maintenance card that coordinates inventory, production and approvals, turning prediction into governed execution.
Read article · 6 min →Manufacturing & FMCGWhy Your SKU Portfolio Is Quietly Killing Margin
Manual, spreadsheet-driven SKU rationalisation fails because it treats a data problem as a one-off cutting exercise. A governed, AI-assisted scoring and what-if simulation approach turns it into an ongoing, cross-functional decision process instead.
Read article · 6 min →Manufacturing & FMCGDavid vs. CPG Goliaths: How AI Empowers Mid-Market Food Manufacturers to Compete
AI is levelling the field between mid-market food manufacturers and enterprise-scale CPG competitors, through better demand forecasting, computer-vision quality control, faster product development, and the agility to deploy faster than legacy-bound giants.
Read article · 6 min →Get in touch
Frequently asked questions
Yes, modules are independently useful; most clients start with the area causing the most pain and add others over time.
Either or both, the suite is built to work from whatever combination of SAP exports, WMS data and email reports you currently use.
Typically a matter of weeks per module, since it's built on your existing data rather than new infrastructure.
It buckets every SKU into grow, hold, rework or discontinue, then lets your team run what-if scenarios against those buckets before anything is final, the AI does the sorting and scenario math, your team stays in control of the call.
Both, the demand forecasting and planning module is specifically forward-looking, not just a historical report.
Freight cost analytics by route and rate analytics across lanes and distributors make leakage visible in real time, instead of being discovered after the fact.
FMCG, food & beverage, dairy and auto components businesses running multi-SKU, multi-lane, multi-distributor operations.
No, it's built directly from your existing SAP, WMS and email data, with no ERP change required.