Every portfolio company in one place: live, reconciled, board-ready.
A single platform for PE and VC firms to monitor portfolio companies across monthly, quarterly and annual board cycles, built on the Excel packs and decks the companies already prepare.
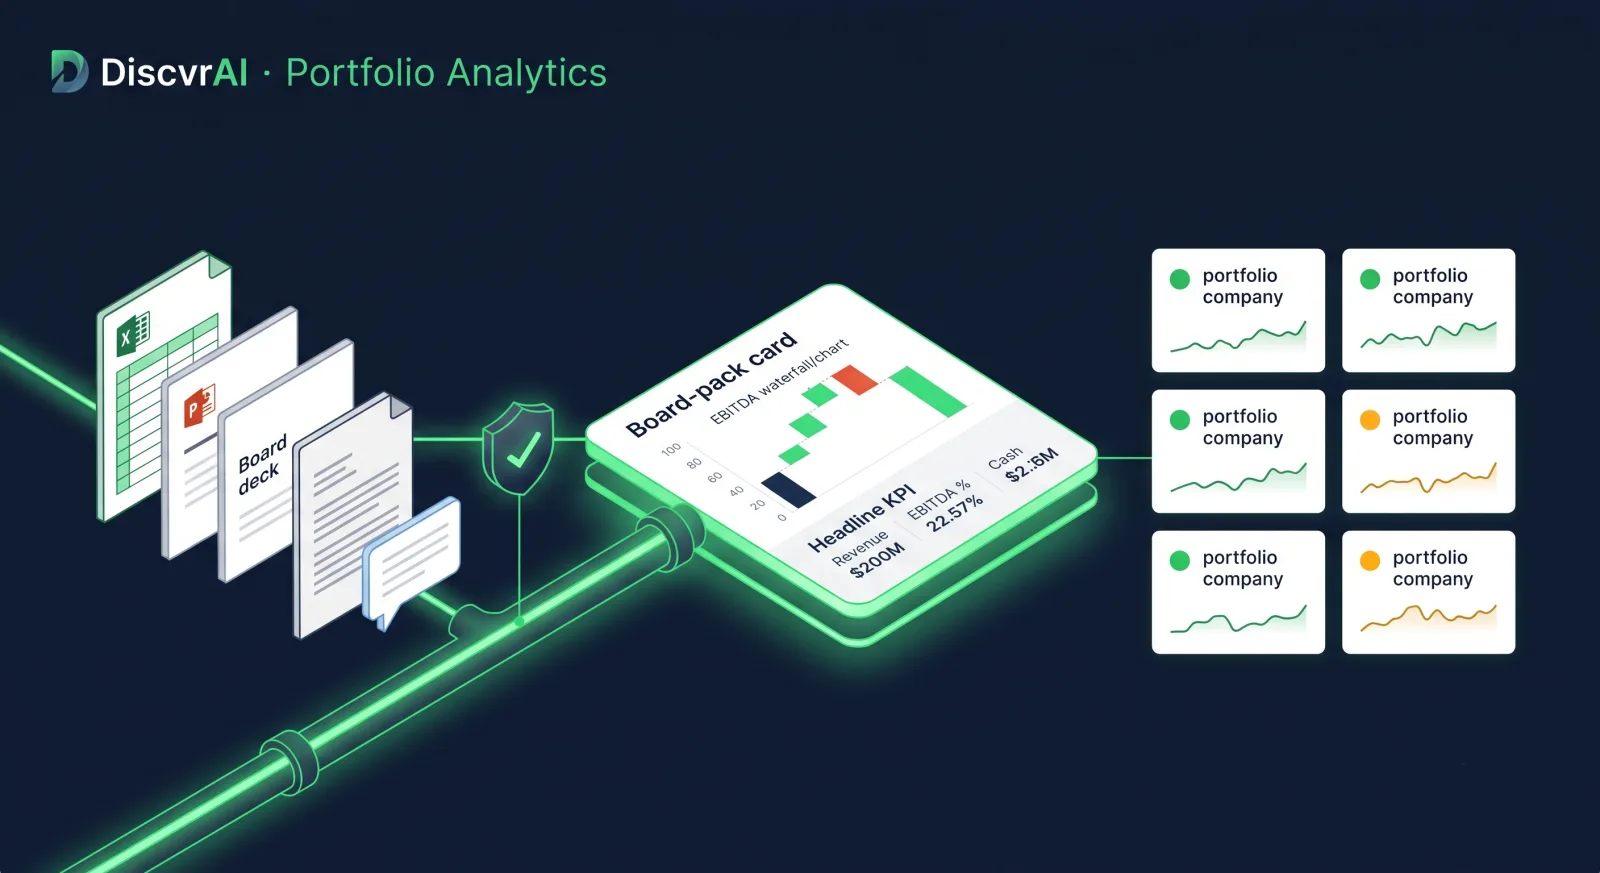
The numbers are computed. The AI only phrases them.
Every bridge and variance is calculated once, in tested code, against a locked convention that reconciles by construction. The board narrative is then generated by the model strictly from that computed output, so it can't invent a driver story, only phrase the one the numbers already show. Management edits it before the pack freezes; nobody authors board commentary from memory again. This is the same discipline that keeps a low-confidence WhatsApp or scanned-page number out of a frozen board pack until finance signs it off.
Who it's for
PE and VC firms, and their operating-partner and portfolio-monitoring teams, reviewing companies through monthly (MBR), quarterly (QBR/board) and annual (budget and strategy) cadences. It is built for multi-entity, multi-site groups, including those growing by acquisition, and it gives each portfolio company's own finance team a place to prepare and defend the numbers rather than a portal they have to learn.
Typically championed by
The shift
Portfolio monitoring runs on the Excel packs and PowerPoint decks each company prepares, rebuilt by hand every cycle. The revenue and EBITDA bridges are fragile hand-built waterfalls; acquired-entity history breaks the trend line or gets fudged in a footnote; cost-savings claims are self-reported and never tied back to the P&L; and the board pack itself is someone's weekend. Comparing two portfolio companies means opening two bespoke models, so the fund-level view every operating partner wants exists only in their head.
Portfolio monitoring stops being a monthly rebuild of fragile Excel and becomes one reconciled platform. Acquisition history, unverified savings claims and silently restated numbers stop undermining the pack. The board deck becomes a one-click output in the firm's own template instead of an analyst's weekend, and the fund-level view that used to live in an operating partner's head becomes a query the moment a second company is onboarded.
How it works
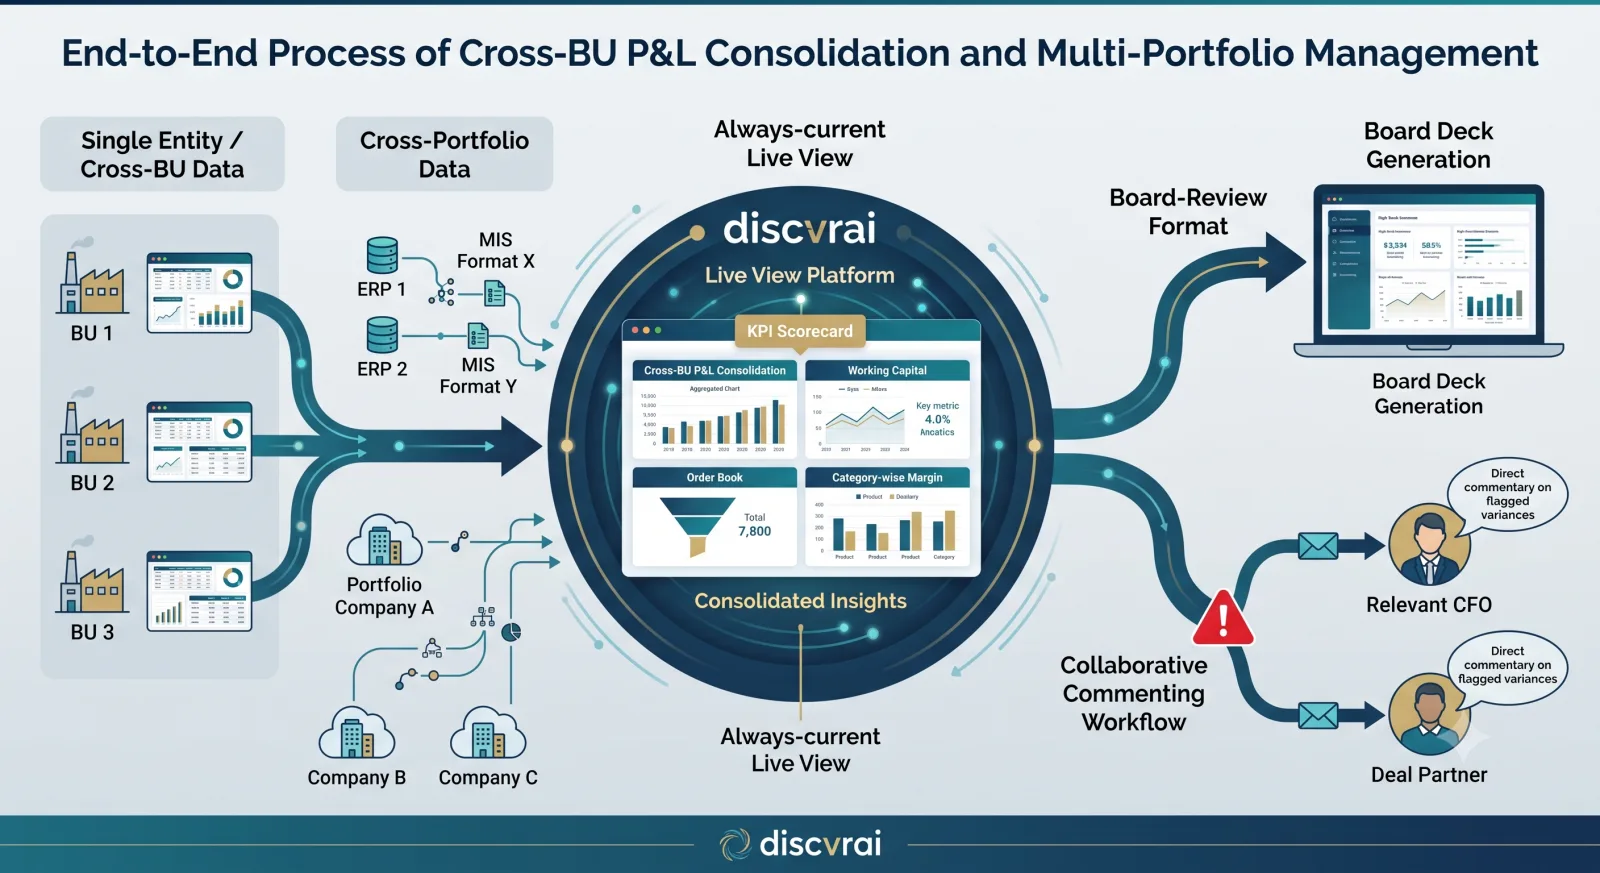
The platform complements the workflow instead of replacing it. It ingests the company's existing Excel MIS, board decks, scanned pages, API exports and ad-hoc chat updates, tags every figure with its source and a confidence score, and maps it once to a versioned metric registry that is reused every cycle. It then computes the variance and bridge analytics that are the spine of any board pack (Actual vs Budget vs Last Year vs the underwriting case), runs reconciliation gates on every load, and exports the finished pack in the firm's own template. Low-confidence figures surface early for management but can never silently become a frozen board number.
- Step 1
Ingest what they already send
Excel MIS packs, the board deck management already presents, scanned or photographed pages, API exports and chat updates all flow in, each row carrying its source channel and a confidence score. Nobody has to change how they work or learn a new template.
- Step 2
Map once to the metric registry
Each company's labels are mapped to a versioned semantic layer, with the mapping suggested by the model and confirmed by an analyst, then saved and reused every month. This is what makes the platform portable: a new company maps its data, and the dashboards need zero rework.
- Step 3
Compute the bridges, gate the numbers
Revenue price/volume/mix and EBITDA bridges are computed against a locked, tested convention that reconciles by construction. Reconciliation rules run on every load, and any breach lands the data in a draft state with a discrepancy report rather than being silently adjusted.
- Step 4
Export the pack in your template
The board deck becomes an output of the pipeline, not a manual rebuild, exported one-click into the firm's own layout with a management-editable narrative grounded on the computed numbers. Issued packs are frozen, so the board and management always read identical figures.
Modules & sub-capabilities
Executive Summary
The board page: a headline strip of revenue, EBITDA and margin, utilisation, cash conversion and savings run-rate, each shown as Actual, versus Budget and versus Last Year with favourable/unfavourable colouring. An auto-generated variance narrative and exception tiles surface anything breaching a threshold, alongside management-owned risks and board-support asks.
Financial Performance
Revenue price/volume/mix and EBITDA bridges as drill-through waterfalls, a P&L versus Budget versus Last Year with variance columns and sparklines, an operating-cost trajectory indexed against an input-cost overlay to separate market-driven moves from controllable ones, and a working-capital and cash view with a cash-conversion-cycle waterfall.
Operations & Unit Profitability
A scorecard grid of every site or business unit, each RAG-rated versus budget and versus the fleet median, with a unit-level P&L waterfall whose cost-allocation basis is disclosed on screen. Like-for-like benchmarking compares units of the same archetype, and utilisation detail decomposes rated to available to produced with a named bottleneck per unit.
Value-Creation & Initiative Tracker
The feature Excel handles worst. Every cost-savings, synergy or value-creation initiative is an object with an owner, target, phasing curve and status, and its realised savings are tied back into the EBITDA bridge automatically. A claimed saving that doesn't move the relevant cost line gets flagged, not discovered two quarters later.
Commercial Performance
Revenue, volume, realisation and margin by end-market and customer, with customer concentration tracked as a monitored trend against a threshold rather than a once-a-quarter table, and realisation shown against the input-cost index to expose pass-through lag. Export mix and currency exposure are read together as a natural hedge, not as unrelated lines.
Capex & Investment Tracking
Approved, committed and spent by project against plan, with capacity added and ramp status tracked from first spend to steady state, and post-completion payback measured against the case. For a capital-heavy or acquisitive company carrying deal debt, this is where the balance-sheet cash actually goes, and it belongs in the board pack rather than a separate finance file.
Board Pack & Review Workflow
Cadence-aware packs (a short monthly, a full quarterly, an annual strategy view), one-click export to PPT or PDF in the firm's own template, a snapshot freeze with a restatement delta log so late restatements are visible, an action tracker that rolls board asks forward until closed, and a commentary layer that persists into the export.
M&A Integration & Pro-Forma Command Center
The module generic BI has no model for. A pro-forma versus as-reported toggle keeps a unit's trend continuous even when a legal entity merges or is divested; synergy plans are tracked against realisation per deal; integration milestones carry an owner and RAG status; and a deal scorecard shows, per acquisition, EBITDA at close versus now, synergy realisation and milestone completion.
Trust & governance
Board numbers have to be defensible, so the platform is built around trust rather than speed alone. The tenant is the firm, with hard isolation between firms. Roles run from deal team and operating partner to portfolio-company management, portfolio finance and a board guest who sees only frozen packs, with row-level security by company and by scenario, so management can see draft actuals while the board sees only frozen snapshots. Reconciliation runs on every load, low-confidence sources are gated out of frozen packs until finance promotes them, numbers are never silently adjusted, and every view and export is audit-logged.
The three questions every board pack must answer
Every screen in the platform maps to one of these. If a screen answers none of them, it isn't in the product.
Are we delivering against the thesis?
Performance versus Budget, versus Last Year and versus the underwriting case, so the investment case is always in view, not reconstructed before a big meeting.
What is driving or hurting performance?
Bridges, drivers and site, customer and segment cuts that decompose a movement into price, volume, mix, cost and acquisition effects.
Where does management need board support?
Initiatives at risk, decisions pending and capex asks, owned by management and rolled forward until they close.
Where Excel and Power BI stop
| Today (Excel + PPT, or Power BI on the same Excel) | Portfolio Analytics |
|---|---|
| The price/volume/mix bridge is a hand-built waterfall, redone from scratch each month, with formulas fragile to any structure change. | The bridge math is a locked, tested convention computed once in code: the same formula every month, every company, reconciling by construction. |
| Acquired-entity history either breaks the trend line or gets fudged in a footnote. | Entity lineage is data. A pro-forma versus as-reported toggle keeps a unit's trend continuous even when a legal entity merges or is divested. |
| "Organic vs acquired growth" is a one-off special analysis someone does before a big board meeting. | Acquisition-perimeter isolation is always on. Every revenue and EBITDA bridge splits it by default. |
| Savings trackers in a deck are self-reported; nobody checks whether the money actually shows up in the P&L. | Initiative-to-P&L tie-out is automatic. A claimed saving that doesn't move the relevant cost line gets flagged. |
| Board numbers get quietly corrected between meetings; nobody has a clean before and after. | Snapshot freeze plus a restatement delta log: the board sees exactly what changed and when. |
| Comparing two portfolio companies means opening two bespoke Excel models. | Once both companies map to the same metric registry, cross-portfolio comparison is a query, not a project. |
What you can't get from Excel or Power BI
An operating partner can already build a bridge chart in Excel and a unit grid in Power BI. These four remove the failure modes that make boards distrust company-prepared decks.
Locked bridge math
Price/volume/mix and EBITDA bridges computed once in tested code, reconciling by construction, identical every cycle and every company.
Entity lineage & pro-forma
M&A events held as data, so acquired history is honest and every trend can render as-reported or pro-forma continuity.
Initiative-to-P&L tie-out
Value-creation savings reconciled into the EBITDA bridge, so an unverified claim is flagged, not discovered two quarters late.
Freeze & restatement log
Issued packs are frozen and every later restatement is visible as a delta, so nobody re-writes history between meetings.
“It doesn't just render the same numbers faster. It removes the specific failure modes that make boards distrust portfolio-prepared decks.”
The point of the platform
Complement, don't replace
The companies keep working exactly as they do today. The Excel pack and the deck they already build become inputs; the board deck they present becomes an output of the pipeline. Ingestion takes whatever channel a number arrives on, from a structured MIS workbook to a photographed register or a chat message, and confidence-gating keeps the low-trust channels out of frozen board numbers without blocking management from seeing them early. There is no mandate to touch a company's ERP on day one, and nothing about the way they send data has to change.
From one company to the whole fund
At one company, this is a better board pack. Once two or more companies map to the same metric registry, three things exist that no per-company tool can produce.
Portfolio review in one grid
The same KPIs, variance conventions and freeze discipline across every company: the Monday-morning view an operating partner assembles by email today, standing.
Cross-portfolio benchmarking
Working-capital days, savings realisation, integration-milestone velocity and unit productivity compared like-for-like, because every company maps to the same registry.
Pattern intelligence
Fund-level early warning: companies where receivables drifted beyond a threshold in two quarters, or synergy programmes tracking below half at month nine.
See the board pack, shaped like the company, before a single file is shared.
The onboarding wedge nobody else has: a calibrated skeleton populates every dashboard on day one, then real data flows through the same pipeline and simply outranks it. The mapping session becomes "replace the proxy with real," not "build from blank."
What we need from you
- • One portfolio company to start, and its public shape (sector, sites, entity and acquisition history)
- • The last three months of the packs it already sends, in whatever format
- • One point of contact in the company's finance team
What you get
- • A working board pack for that company, with its own structure, in days
- • The revenue and EBITDA bridges, unit profitability and initiative tie-out on your data
- • A one-click export of the pack in your own board template
Days 1-2
Company profile and a calibrated skeleton on every dashboard
Days 3-6
Map the real packs to the registry; historical backfill
Week 2
Reconciliation sign-off and the first frozen board pack
Agents deployed for this module
These are the named agents we deploy when Portfolio Analytics is the production module for your business problem. Each agent is a job we deploy for you. You do not buy software and install it yourself.
See all agents we deployRelated case studies
A private-equity firm reviewed a multi-entity, multi-site portfolio company through Excel MIS packs and PowerPoint decks rebuilt by hand every board cycle.
Acquisition history, unverified savings and silently restated numbers stopped undermining the pack, and monthly assembly became a reconciled, roughly one-day cycle.
An operating-partner team had no consistent way to tell whether acquisitions were working, since acquired-entity history kept breaking the trend lines.
Organic versus acquired growth and synergy realisation became a standing part of every board pack instead of a one-off analysis before each meeting.
You might also need
Related insights
LLMs Will Not Replace Data Science Models. They Will Make Them Smarter.
LLMs aren't a replacement for classical ML models, they're a way to accelerate feature engineering, turning unstructured enterprise data into structured signal, inside a human-supervised feedback loop that keeps governance intact.
Read article · 6 min →Data & AI StrategyFrom AI Pilots to AI P&L: How CXOs Should Measure AI Transformation
Most AI initiatives don't fail on technology, they fail because no one connects the pilot to a P&L line. AI transformation should be measured in working capital impact, turnaround time, exception rates and fraud prevention, not pilot counts.
Read article · 6 min →Manufacturing & FMCGFrom Dashboards to Decisions: How Agentic AI Can Transform Manufacturing Operations
Manufacturers already have plenty of data, what they lack is speed of decision, since choices stay fragmented across systems and teams. Agentic AI works best as an execution layer on top of existing ERP, starting with one bounded workflow and a human-in-the-loop approval gate.
Read article · 6 min →Get in touch
Frequently asked questions
An operating partner can already build a bridge chart in Excel and a unit grid in Power BI. What neither gives you is a locked, reconciling bridge convention computed in code, acquired-entity history held as data with a pro-forma toggle, automatic tie-out of savings claims to the P&L, and a snapshot freeze with a restatement log. It removes the failure modes that make boards distrust company-prepared decks, rather than just rendering the same numbers faster.
No. The platform ingests the Excel packs, board decks, scanned pages, API exports and chat updates they already produce, and there is no mandate to touch the ERP on day one. The deck they present today becomes an output of the pipeline; the way they send data doesn't change.
No. The fiscal calendar, reporting currency and units are configuration per company, and the metric registry is organised by vertical, so a consumer-brands or services company uses a different operating fact table (stores, occupancy, GMV) from an industrial one without a different platform.
M&A events are held as data in an entity-lineage model, which lets every trend render two ways: as-reported (respecting legal-entity boundaries and cutover dates) and pro-forma continuity (as if the current group structure existed for the whole lookback). A unit's trend doesn't show a false break the month an entity is amalgamated, and every bridge splits organic from acquired growth by default.
Every figure carries its source channel and a confidence score. Reconciliation rules run on every load, and OCR-, image- or chat-sourced figures are hard-blocked from frozen board status until a higher-confidence source supersedes them or a named finance user explicitly promotes them. Low-confidence data can inform draft views without ever silently becoming a board number.
A calibrated skeleton populates every dashboard on day one, so the company sees a working board pack in its own shape before sharing an internal file. Mapping its real packs to the registry and backfilling history typically takes the rest of a two-week window to a first frozen pack. In a familiar vertical, steady-state onboarding is a matter of days with no engineering time.
Yes. Packs export one-click to PPT or PDF in the firm's own template, with a narrative that is generated strictly from the computed bridge output and edited by management before the pack freezes. The board template becomes a configuration, not a rebuild.
The tenant is the firm, with hard isolation between firms. Access runs from deal team and operating partner down to portfolio-company management, finance and a board guest who sees only frozen packs, with row-level security by company and by scenario and full audit logging on every view and export.